Ocean conditions in the Pacific Ocean are increasingly suggestive of a potent El Niño event later this year. While that might seem like good news to the water-starved regions of the United States, the resulting torrential rains could be exceptionally hazardous.
Back in March of this year, scientists declared that El Niño conditions had emerged in the Pacific Ocean. Initially, it was thought that the event was too weak and too late to be of any significance, but conditions have changed over the past several months. According to NASA and other agencies, surface waters are getting warmer in the central and eastern Pacific, while conditions to the west are getting drier and cooler. What’s more, these conditions bear a striking resemblance to the substantial El Niño event of 1997-98.
“We have not seen a signal like this in the tropical Pacific since 1997,” noted NASA JPL climate scientist Bill Patzert at NASA’s Earth Observatory. “It’s no sure bet that we will have a strong El Niño, but the signal is getting stronger. What happens in August through October should make or break this event.”
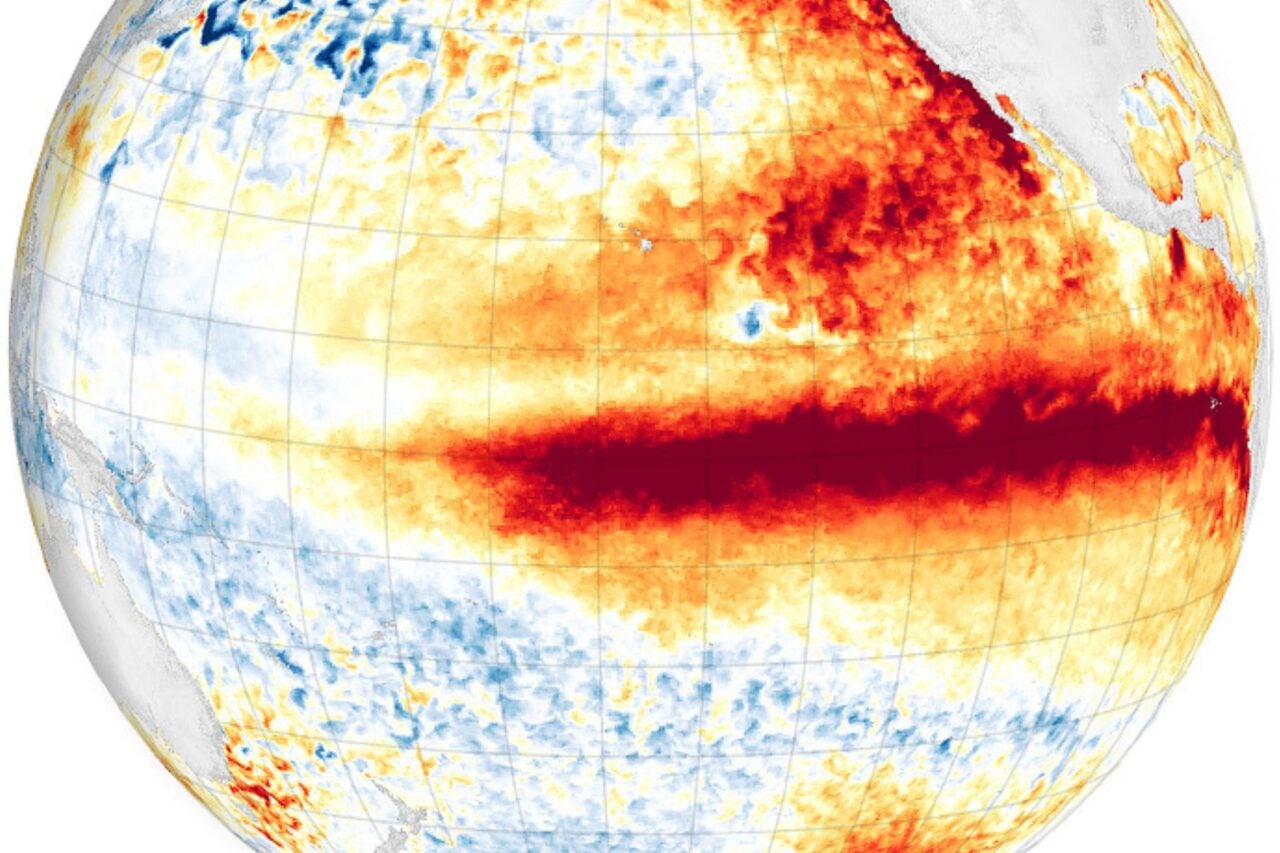
New NASA images taken by the OSTM/Jason-2 satellite show averaged sea surface height anomalies since March 2015. Red indicates regions where oceans have risen above sea level—a sign of warming ocean water. Sea-surface heights have shifted about 50 cm across the Pacific, a strong indication of El Niño’s strength. To add insult to injury, 2015 is poised to be the hottest year on record.
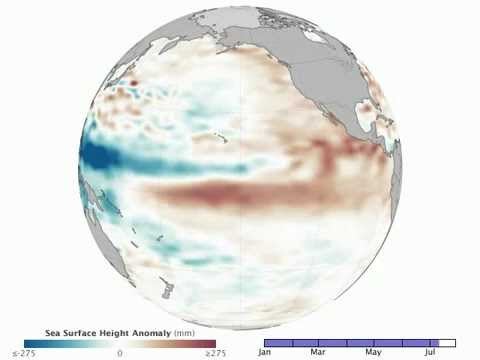
Above is a comparison of sea surface height in the Pacific as measured at the end of July in 1997 and 2015. NASA explains:
The left-side measurements come from the TOPEX/Poseidon mission, while the right side is from Jason 2. Comparing the two years, 1997 seems slightly less intense. But trade winds collapsed and the eastern Pacific warmed dramatically from August through November 1997, setting the stage for a turbulent winter that brought flooding rains and landslides across the West Coast of North and South America.
Indeed, and as noted by Patzert, some people in the American west are touting El Niño as “the great wet hope,” but he warns that the ensuing rains could produce the same “mayhem” experienced in 1997. This archived article from National Geographic should give you a good idea of what we might expect—everything from torrential rains and flooding through to the spread of diseases and social unrest.
Traditionally, El Niño reaches it peak between December and April, so there’s still time for conditions to change. Factors that could influence its growth include the “warm blob” in the Pacific and shifts in the Pacific Decadal Oscillation.