The latest scientific report on the state of climate change spells out a warmer, doom-filled future, yet for many, this has been the coldest winter in recent memory. Unfortunately, weather isn’t climate, and a regional cold winter isn’t a counter-argument to decades of data.
AP Photo. Clockwise from top left: Jessica Hill, Jae C. Hong, Seth Perlman, and Charles Sykes.
Trends of a Changing Climate
Weather is the day-to-day mix of atmospheric phenomena you experience — a warm sunny day, a biting cold snap, a sudden storm, or even crazy dust devil. Climate is the long-term weather patterns for an entire region — the tropics are warm and wet, deserts are dry, and the Pacific Northwest is perpetually overcast. Occasional abnormal weather can be inconvenient and even damaging, but shifts in climate far more alarming.
The 2013 climate analysis report produced by the National Oceanic and Atmospheric Administration (NOAA)’s National Climactic Data Center and the year-end summary published by NASA’s Earth Observatory spell out the difference in distressing detail.
Every year since 1976 has been above-average temperatures. Anyone 37 or younger has never experienced an average year.
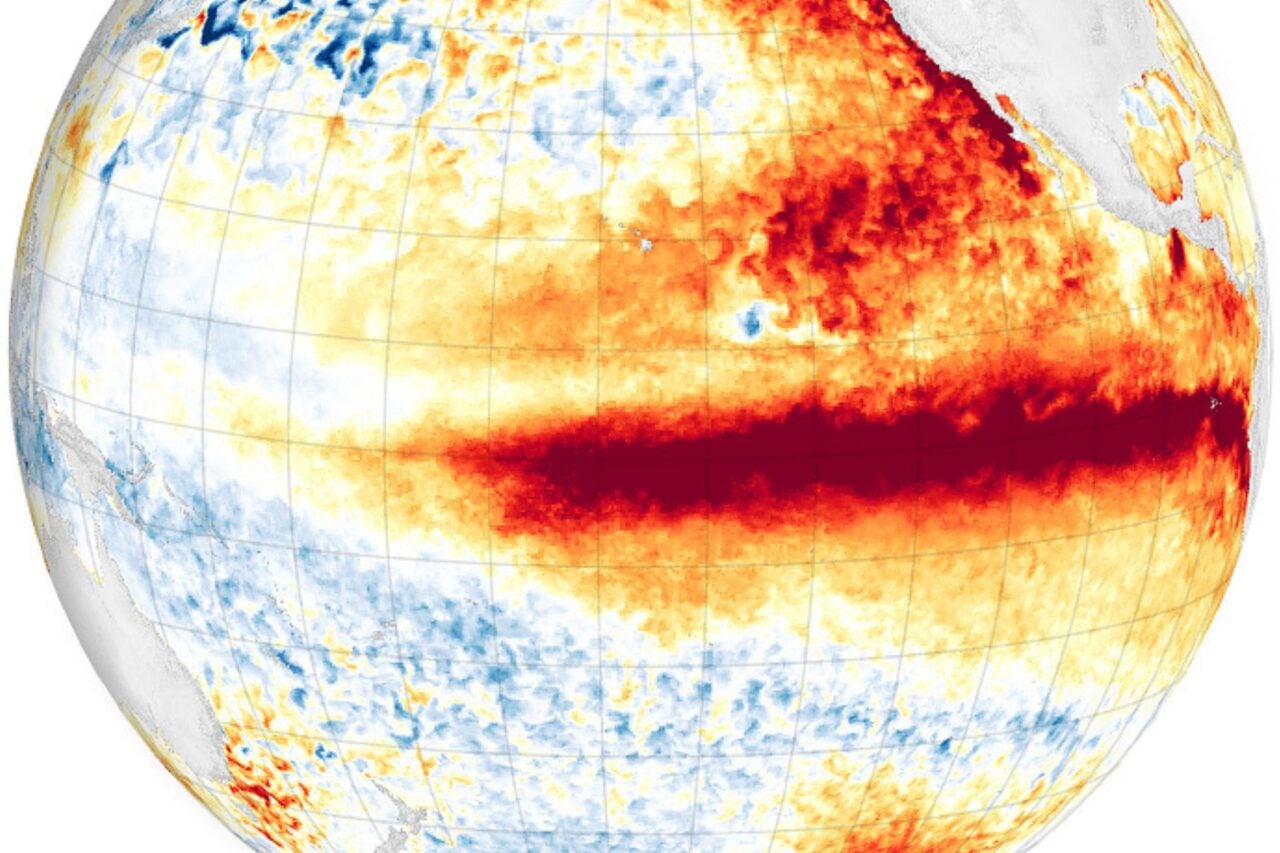
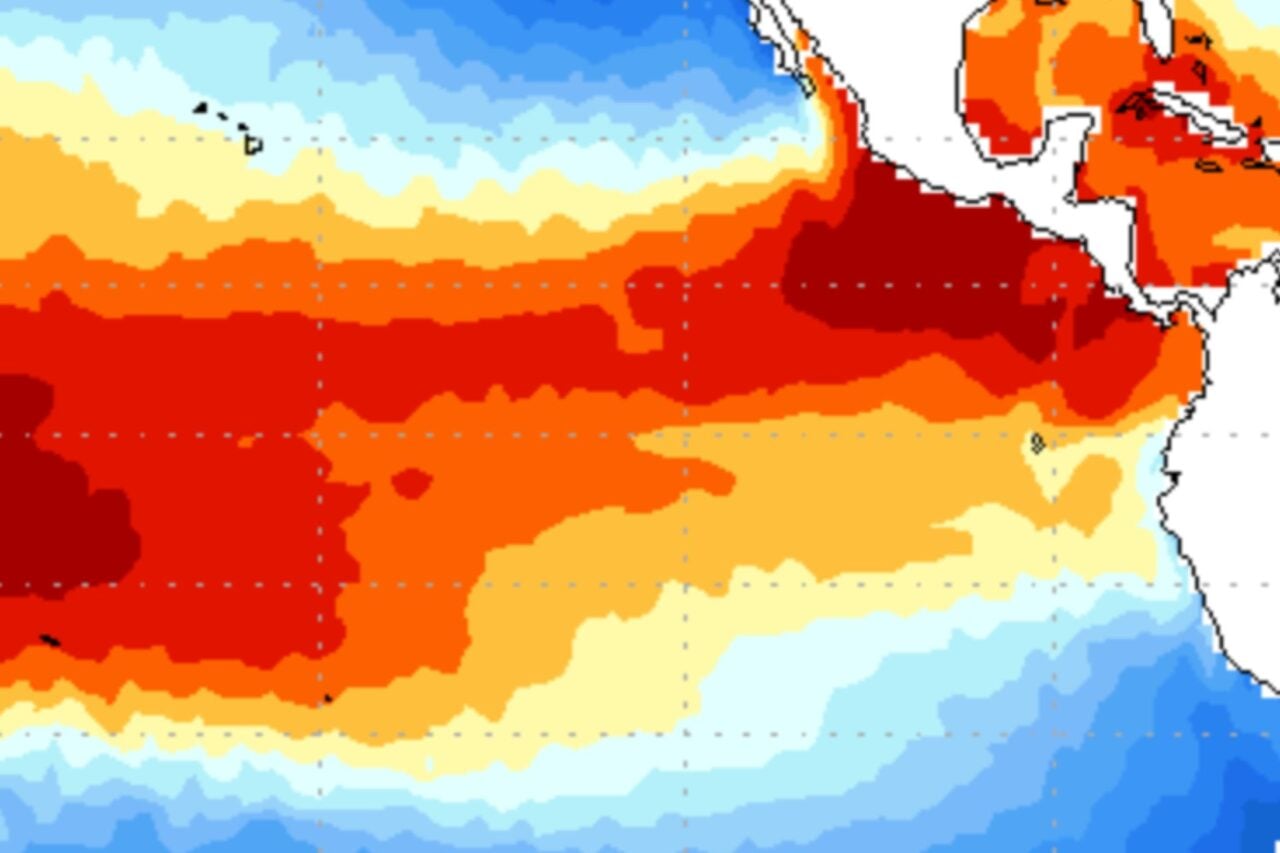
The Earth Observatory produced a chart comparing annual temperatures to an average baseline from previous decades. Taking the three decades from 1951 to 1980 as a baseline average temperature, the sloping black line is the overall temperature trend since 1950. The higher red line is the trend for only El Niño years, when equatorial ocean temperatures in the Pacific rise by at least 0.5 °C. The lower blue line it is the trend for just La Niña years, when ocean temperatures in the same location drop by 3 to 5 °C.
Annual temperature trend compared to the 1951 to 1980 average temperature.
Each bar is the annual temperature for that year, coded red for El Niño years, blue for La Niña years, and grey for years where neither phenomena occurred. El Niño are generally warmer, and La Niña years are generally cooler, but recent years in all conditions are warmer than they used to be, and every year for nearly four decades is above average temperatures. When a cranky tv grampa complains that he used to walk to school in feet of snow and kids these days have it easy with their balmy weather, that’s not an entirely fictional grouch.
Looking at last year in more detail, the Earth Observatory published this map of the global temperature anomaly for 2013 compared to that same baseline of the average temperature in 1951 through 1980. Reds are warmer, blues are cooler, with the colours darkening in intensity to correspond with greater deviation from the average temperature.
2013 temperature map compared to the 1951 to 1980 average temperature.
It’s possible to cherry-pick a few locations where the annual temperature was near the historic average, or even find a few patches where it got distinctly cooler, but overall this is a map bathed in the red of a warming world. What does that mean? The Earth Observatory write-up on this long-term warming trend quotes Goddard Institute for Space Studies climatologist Gavin Schmidt:
“Long-term trends in surface temperatures are unusual, and 2013 adds to the evidence for ongoing climate change. While one year or one season can be affected by random weather events, this analysis shows the necessity for continued, long-term monitoring.”
For a slightly different perspective, compare last year to the more recent past. NOAA put 2013 in the context of a modern baseline, the average temperatures of 1981 through 2010. The result is equally distressing:
2013 average temperature compared to the 1981 to 2010 average temperature.
While much of North America was only slightly warmer (west coast) or cooler (east coast) than average, Australia set record-breaking a hottest year yet. The planet overall experienced warmer than average temperatures, or even much warmer than average temperatures. Most of the Pacific was near average temperatures, and a few small patches in North and South America had a cooler than average year. Only a tiny region between the horn of South America and the hook in Antarctica had a much cooler than average year, and no where on the entire globe experienced it’s coldest year on record.
The global average temperature has risen about 0.8°C since 1880. At an average global temperature of 14.6° C, 2013 was 0.6°C above just the historic 1951-1980 baseline average. Weather patterns and natural cycles cause fluctuations at particular locations, or even globally between years, but the long-term climate is changing to a hotter planet.
Tired of averages? The same patterns hold when only looking at the extremes of hottest years.
1988, the hottest year on record when global warming first hit the news cycle, isn’t even in the Top 20 hottest years.
In 1988, NASA scientist James Hansen testified about global warming at a Senate Hearing. That day, global warming became a news topic, and the phrase entered popular media. That year was the hottest on record, underscoring the message of a warming planet. Now, 1988 isn’t even in the Top 20 hottest years.
1988 droughts in Iowa. AP Photo/John Gaps III
During the drought in June of 1988, farmer Firmin Rottinghauf, age 72, was photographed in his drought-damaged cornfield in Gilbertville, Iowa. He called the conditions, “the worst I’ve seen since ’36.” Twenty of the next twenty-five years have been hotter.
It doesn’t get any better when cutting down to just the Top 10 hottest years. From the NOAA Global Analysis:
Including 2013, 9 of the 10 warmest years in the 134-year period of record have occurred in the 21st century. Only one year during the 20th century—1998—was warmer than 2013.
Welcome to the new normal.
Shifting Baselines
The National Weather Service Weather Forecast Office just released this series of satellite images of Lake Superior over the last several years. 2014 is shaping up to be a cold winter for Michigan, with full snow cover and lake ice at the end of March. The last truly cold winter in the state was in 2008-2009, but by the same time that year Lake Superior was nearly ice-free.
Ice coverage in Upper Michigan in recent years. Image credit: NOAA
Within such a short time frame, 2014 is shaping up to be a doozy of a cold one. Indeed, the last time the Northern Hemisphere experienced substantial spring snowpack was in 1996. Yet, prior to the infamous 1988, most years had substantial snowfall.
The spring snow coverage in the Northern Hemisphere has declined in recent decades, as shown on this NOAA chart. The chart divides spring snow coverage by above and below the average covering in 1971 through 2000.
Spring snow cover in the Northern Hemisphere. Image credit: NOAA
The baseline average covers almost the entire time recorded on the chart, setting average is set almost exactly in the middle of the timespan. Earlier decades had above-average snowfall, and later decades had below-average snowfall. Although a few years are rare exceptions, it is painfully clear that the past was far more snowy than the present.
So why does this year feel so bad in the northeast? Because of a concept called shifting baselines. Our point of reference for what normal looks like keeps changing, updated to our most recent past. Like the difference between the Earth Observatory comparing current climate to the 1951 to 1980 average versus NOAA using 1981 to 2010 average temperatures, the basic point of reference for describing our world keeps changing.
The snow that snarled Atlanta was inconvenient and even a disaster due to modern infrastructure limitations, but it wasn’t anywhere close to the record-breaking southern snowfalls of decades past. The winter that refuses to end in the northeast, breaking hearts with March ending in a decidedly un-lamb-like manner? Weird for the past few decades, totally normal before that. The younger residents of Massachusetts probably feel like their winters are totally typical, but they’re actually experiencing a climate stolen through time from a pre-1980s Pennsylvania. Artist and weather-geek Randall Munroe tells the story with surprisingly emotive stick figures in this piece from xkcd:
A warming climate can have anomalous weather, a severe cold spell mimicking the normal patterns of the not-so-distant past. The polar vortex and the endless winter are a dramatic slap compared to recent years, but not that long ago this used to be normal. For the northeast, this winter is a taste of what your weather used to be.
Climate has changed so much that our very perception of what normal looks like has changed to keep up. Our baselines have shifted, and while the records hold the story of a statistical change over time, our memories are losing hold of the not-so-distant past.
Adjusting to a Changing Climate
Arguing about if climate change is happening and how much is our fault won’t change the basic fact that we’re running an unplanned global experiment on the only planet we live on. In an interview with the Guardian about the Intergovernmental Panel on Climate Change (IPCC) report, Chris Field, outlines the current state of affairs as, “We are now in an era where climate change isn’t some kind of future hypothetical.”
IPPC report map of events attributable to climate change.
Businesses with an eye on the future are already developing plans to cope with climate change. When Chipotles listed climate change as a material risk to avocado pricing and availability in their annual 10K filing, headlines decried it as ridiculous fear-mongering over a post-apocalyptic future. But, it was a totally reasonable thing to do. Avocados would already be extinct without the dedicated intervention of humans, so it isn’t hard to imagine that our changing climate could endanger the awkward fruit, driving up costs for the key component of guacamole.
It’s stale news that insurance companies take climate change seriously. Risk Management Solutions (RMS) is a modelling company that creates software that enables insurance companies to calculate risk. During a September 2013 interview with Salon, their chief scientist Robert Muir-Wood explained, “Our business depends on us being neutral.” To make the very best assessments of risk today with no vested interest in why those risks occur, RMS can’t rely solely on the past. “With certain phenomena in certain parts of the world, that the activity today is not simply the average of history.”
In May 2013 interview with the New York Times, the president of the Reinsurance Association of America, Frank Nutter, pinpoints the futile conflict between science and politics succinctly, saying, “Insurance is heavily dependent on scientific thought. It is not as amenable to politicized scientific thought.”
Disasters are a costly business for insurance companies. The most expensive catastrophes of 2012 were Hurricane Sandy and the drought in the Midwest.
Devastation immediately after Superstorm Sandy (top), and six months later (bottom). AP Photo/Mel Evans
Insurance company Munich Reproduced a press release addressing how these catastrophes like Sandy and the drought were adding up to major losses at substantial cost to the insurance (and reinsurance) industry. In it, their Head of Geo Risks Research, Professor Peter Höppe, bluntly explains:
“These two catastrophes clearly demonstrate the type of events we can expect to contend with more often in the future. It is not possible, of course, to attribute individual events to climate change, each theoretically being possible in isolation. However, numerous studies assume a rise in summer drought periods in North America in the future and an increasing probability of severe cyclones relatively far north along the US East Coast in the long term. The rise in sea level caused by climate change will further increase the risk of storm surge. And, with no apparent prospect of progress in international climate negotiations like those held recently in Doha, adaptation to such hazards using suitable protective measures is absolutely essential.”
In other words, climate change is real, and the politicians of the world aren’t settling down to make a serious effort at mitigation, so insurance companies better start hedging their bets to avoid future losses.
Climate change is a slow-onset catastrophe with insidious, devastating consequences, and it’s long past time to start planning how we’re going to cope with it. Mitigation and adaption are key to surviving in this changing world, or we’re going to be left reeling as we try to catch up.
So, what now? I wish I had an answer for you. All I know is, it’s going to be ugly.
For further reading, I highly recommend the NOAA and the Earth Observatory reports for 2013, and this curated gallery of climate change visualizations. If you want far more data, the IPCC report is freely available to the public. To get more depressed, read more about the US War on Science and crushing of children’s dreams. If you’re now feeling hopelessly depressed, please try this story of a fawn rescued from hungry foxes, or this surreal image of a gigantic inflatable polar bear in a NASA hanger.