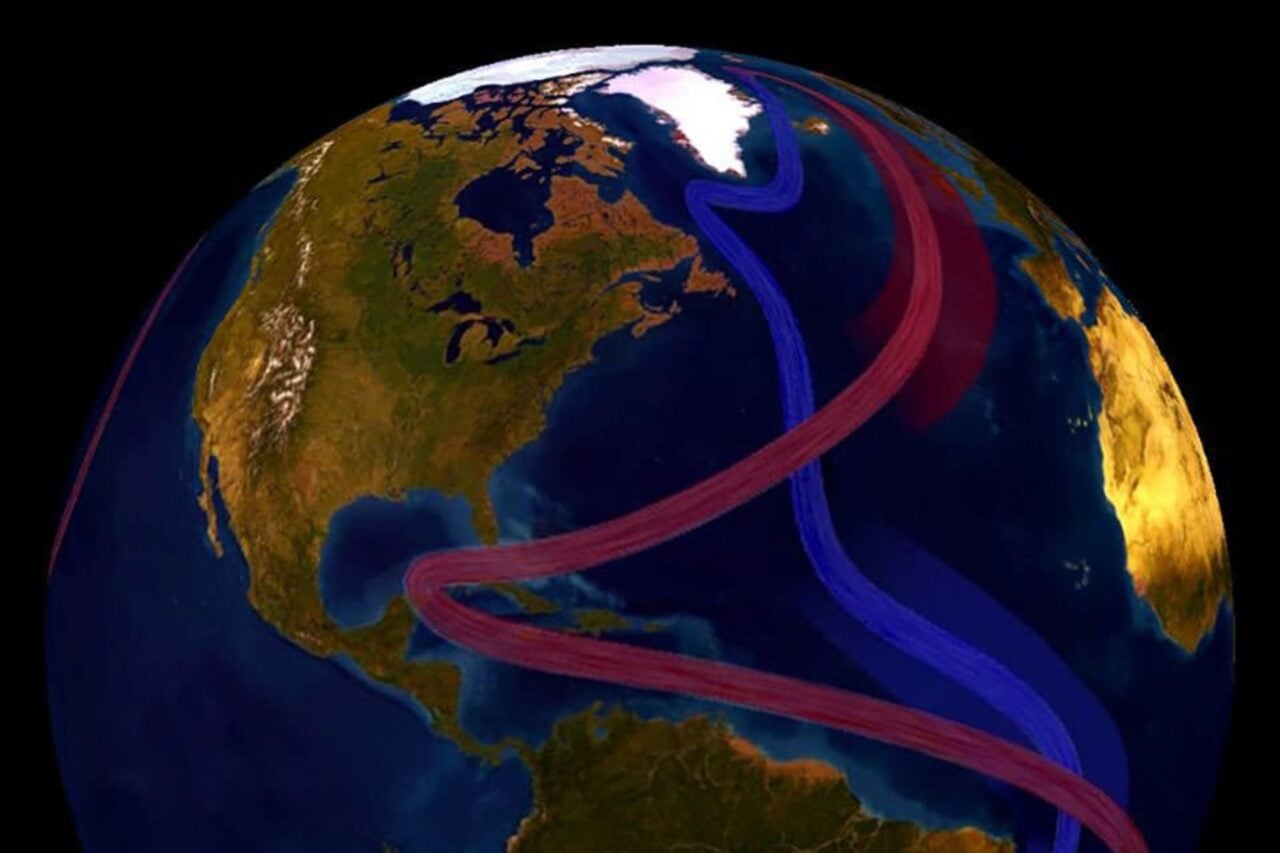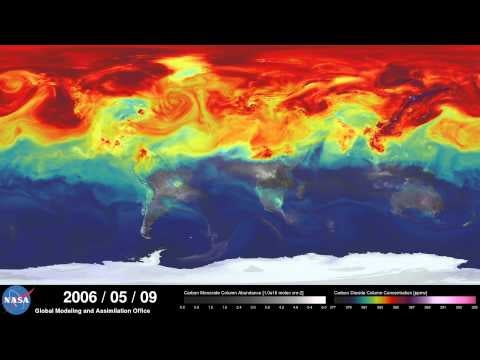
NASA scientists have produced an ultra-high resolution computer model showing the ebbs and flows of carbon dioxide over the course of an entire year. It’s both stunning and undeniably frightening.
This is the first hi-res simulation to show in such fine detail how carbon dioxide actually moves through the atmosphere. Watching it, you can see seasonal differences as plumes of CO2 swirl and shift. The northern and southern hemispheres feature swings in concentrations as the growth cycle of plants and trees changes.
Specific geographical areas, such as North America, Europe, and China, can be seen churning out thick swirls of CO2. But some of it is natural, such as those concentrations produced by wild fires.
The visualization, which was created by scientists at NASA Goddard’s Global Modeling and Assimilation Office, was made possible by a computer model called GEOS-5. It’s part of a simulation called a “Nature Run” where real data is processed on atmospheric conditions produced by greenhouse gases and both natural and human-made particulates. The model is then is left to run on its own to simulate the natural behavior of the Earth’s atmosphere.
This particular Nature Run simulates May 2005 to June 2007. So given that carbon emissions are still increasing, the model actually downplays the true scope of the situation.
More at NASA.