Climate change isn’t just coming — it’s already here. Just check out these 10 charts that show everything from how much it costs to heat or cool our homes to the amount of rain we’ve been getting.
The National Climate Assessment, a government report on the rapidly changing climate in the U.S., was released today. The report goes into some detail about the future changes that we’ll be seeing in the climate — but some of the most interesting findings focus on the changes that we’ve already seen, or are seeing right now.
Here are a couple of the NCA findings, broken down into charts:
1) The average temperature has gone up by between 1.3°F and 1.9 °F since 1895, but different regions around the country have experienced different changes, as this map shows:
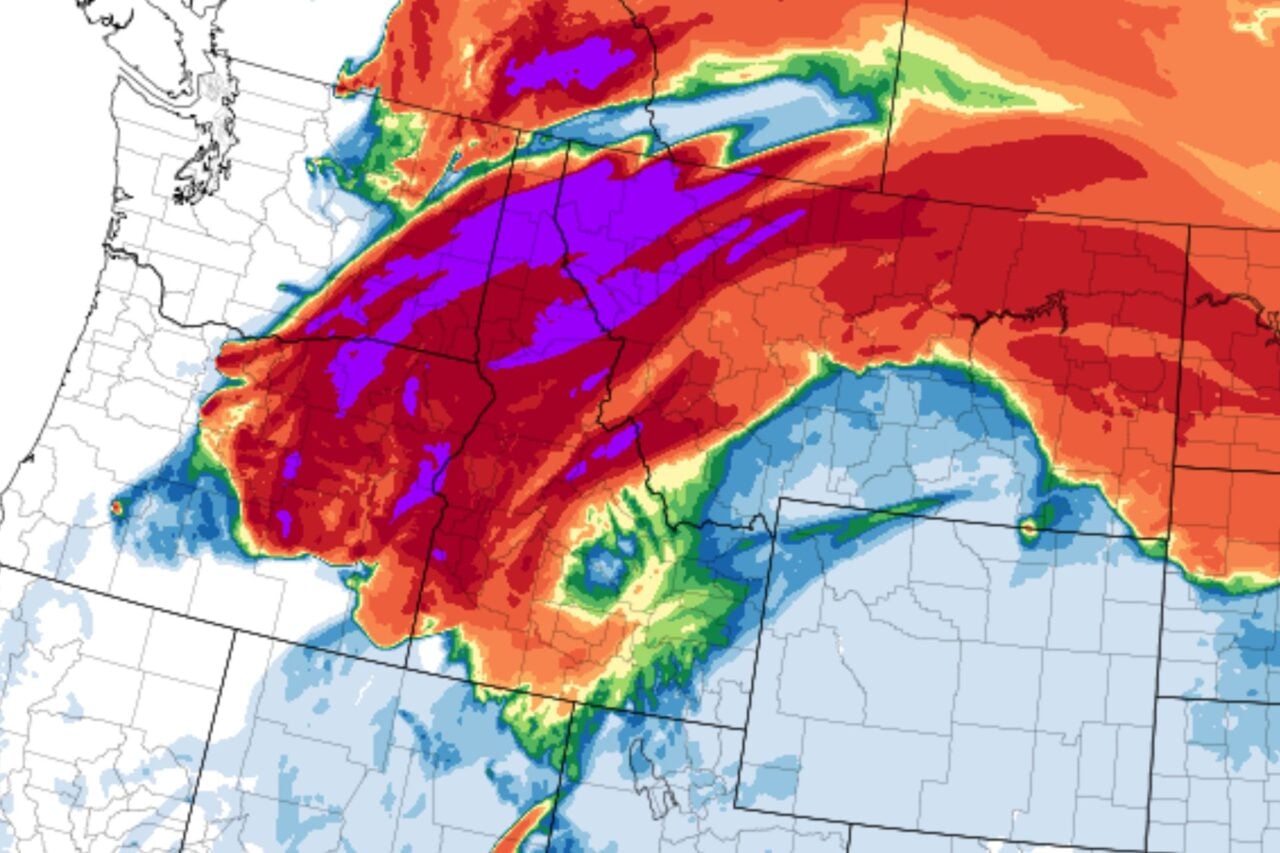
2) Many areas of the country are wetter than they were in 1900, as you can see on this map that contrasts the average precipitation from 1991 – 2012 to levels from 1901-1960:
3) Not only is the amount of precipitation changing, the way it’s delivered is also changing, as this chart looking at “extreme precipitation events” (defined by the NCA as “a 2-day precipitation total that is exceeded on average only once in a five-year period”) represents:
4) Sorry allergy-sufferers — the season for ragweed has increased from 1995 – 2011 by 11-27 days.
5) Between 1970 – 2010, the number of days where there is a demand for heating fell, while the demand for cooling rose.
6) You can see the increase in carbon emissions — and where they’re coming from — from 1850 to 2009:
7) Parts of the country where there’s “water stress” (defined as demand exceeding 40% of the available supply.)
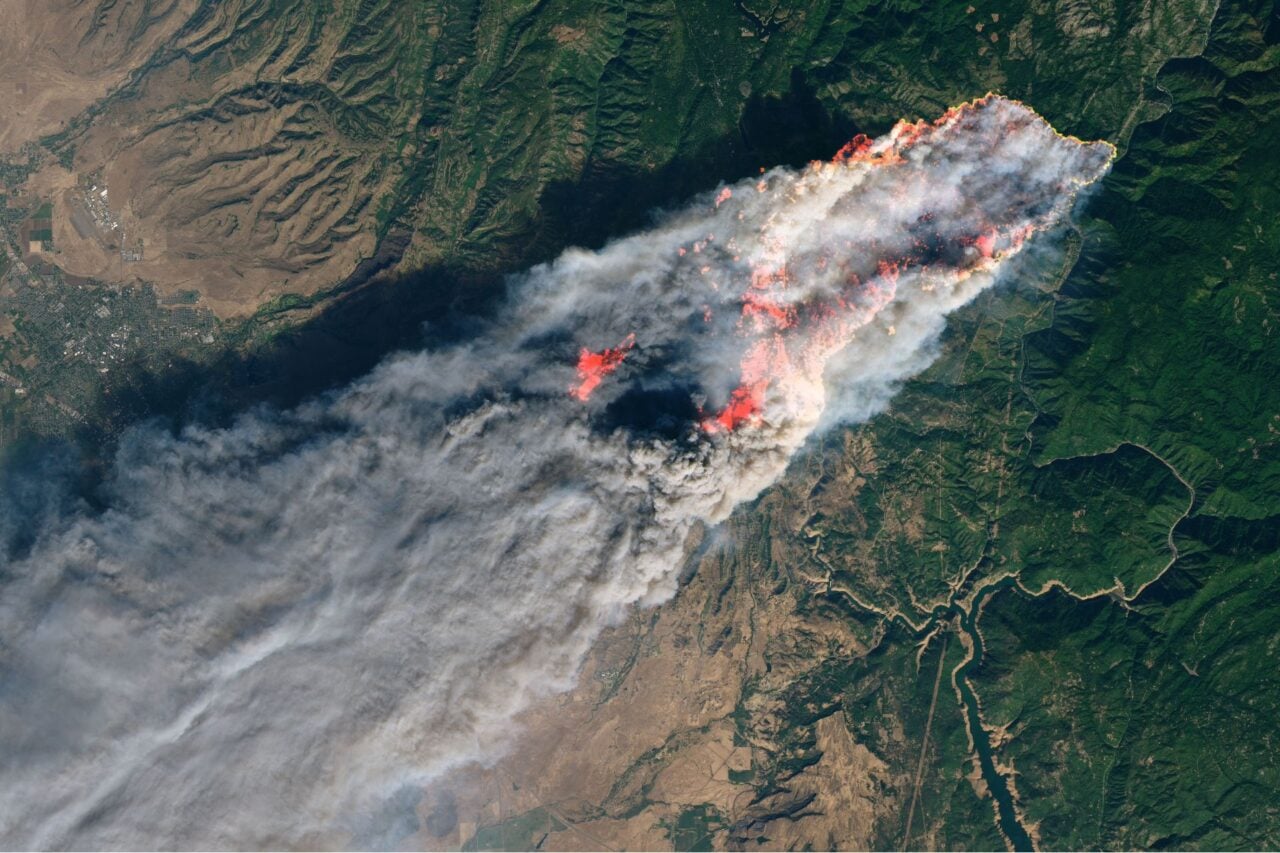
8) More buildings in California are being lost to wildfires, as you can see in this chart looking at losses from 1970 to 2007.
9) The number of days that the temperature exceeded 100°F in 2011, mapped:
10) The rise in average global surface temperature over the last five decades — with each decade since 1950 warmer than the last.
There’s much more about the current and future impact of climate change on the U.S. over in the full report.